Job Decision Matrix: Make Your Next Career Move With Confidence
Few moments in professional life carry as much weight as choosing between job offers. You have done the interviews, weighed the culture, compared the compensation, and now you sit with two or three opportunities sprawled across your desk. Or maybe you are trying to decide whether leaving your current role is even worth the risk. Either way, the pressure is real, and gut feelings only take you so far.
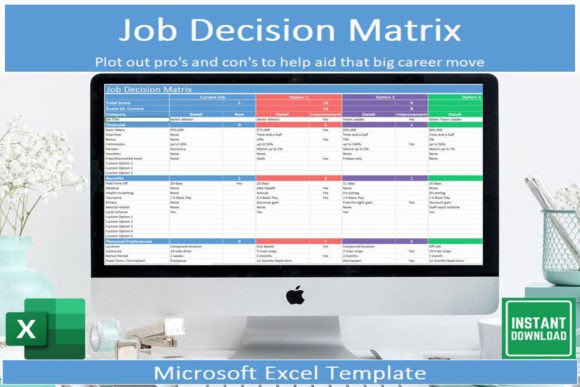
That is exactly where the Job Decision Matrix I Job Decider Helper steps in. This Microsoft Excel template strips away the noise and gives you a structured, repeatable way to compare offers side by side. Instead of bouncing between mental pros-and-cons lists, you assign a simple yes to whichever option wins on each attribute you care about. The spreadsheet tallies everything automatically, and the highest score signals the most promising choice. It even compares your score against your current role, so you can see whether a move is genuinely worth making or just a lateral shuffle dressed up as progress.
What You Get Inside the Spreadsheet
The download includes a single Excel workbook with everything laid out clearly. You do not need to build formulas or fiddle with macros. Here is what is waiting for you:
- A clean Job Decision Matrix tab with pre-existing attributes like salary, growth potential, commute time, culture, benefits, and job security. These are already in place so you can start scoring immediately.
- Simple yes-based scoring for each attribute. You evaluate every offer against each criterion and mark which one comes out on top. The matrix handles the math.
- Customisable offer names so you can label opportunities however you want. Whether you call them Offer A, Offer B, Current Role, or use company names, the spreadsheet adapts instantly.
- An additional attribute section that lets you add criteria specific to your situation. Maybe you care about parental leave, remote flexibility, or the quality of the office coffee. Add it, score it, and let the numbers speak.
- Built-in comparison to your current role. This is the feature that separates a simple ranking from a genuine career decision tool. You see not only which offer scores highest but also whether that score actually beats what you already have.
- Full instructions explaining exactly what everything means and how to use the sheet without guesswork.
You can open the file on your desktop or download the free Microsoft Excel app to update scores on your phone. That means you can tweak your matrix during a commute or between meetings without breaking your flow.
Why a Structured Decision Tool Works Better Than Gut Feel
When you are in the middle of multiple job negotiations, emotions run high. A higher salary can blind you to terrible work-life balance. A prestigious company name can make you overlook a toxic team. The Job Decision Matrix I Job Decider Helper forces you to separate each factor and judge it on its own terms.
Think of it as a decision audit trail. Once you lay out salary, commute, culture, growth, and benefits as separate rows, you can see exactly why one offer edges ahead. It also reveals where you are making trade-offs. Maybe Offer A wins on compensation and benefits, but Offer B dominates on culture and flexibility. The matrix gives you a clear picture of the trade-offs rather than letting you fixate on one big number.
For designers, marketers, bloggers, and small business owners, this kind of clarity matters even more. Many creative professionals juggle multiple income streams, freelance contracts, and part-time roles alongside full-time offers. The matrix helps you evaluate each opportunity in context, not in isolation. You might discover that a lower-paying role with better flexibility leaves you more time for side projects, and that combination actually outranks a higher salary at a more demanding company.
Setting Up Your Matrix for Maximum Relevance
The pre-loaded attributes cover the usual suspects, but your career values are personal. Take full advantage of the customisable attribute section. If you are a content creator who values creative autonomy above all else, add that as a row. If you are a parent who needs remote flexibility on certain days, add that too. The template is designed to bend to your priorities, not the other way around.
When you evaluate each attribute, be honest about what matters. It is easy to say you value culture, but if you give every offer a yes on that attribute without really differentiating, the matrix loses its edge. Spend five minutes before you start scoring to decide which criteria genuinely separate your options. That preparation alone is worth the price of the download.
Another practical tip: score the matrix once in a quiet moment, then walk away for 24 hours and score again. Compare the two passes. If your scores shift dramatically, you may be reacting to recency bias or pressure from a negotiation timeline. If they stay consistent, you have a reliable signal.
Reading the Scores and Making the Call
Once you have filled in your yeses, the spreadsheet automatically calculates a total for each offer. The highest number is your most likely best choice, but do not treat it as an absolute verdict. The matrix is a decision aid, not a crystal ball. If two offers are within one point of each other, the difference may be noise. In that case, zoom out and consider factors the matrix cannot capture: your intuition about the people you met, the energy of the team, or the long-term trajectory of the industry.
Where the matrix truly shines is when the scores are far apart. If one offer scores four or five points higher than the others, you have strong evidence that it aligns better with your priorities. That does not guarantee happiness, but it does reduce the odds of regret.
The comparison to your current role is the hidden gem here. Many people assume a new offer is an upgrade simply because it is new. The matrix forces you to put your current role on the same playing field and score it honestly. You might discover that your current job quietly outperforms every new option on the criteria that actually matter to you. That is not a failure of ambition. That is a data-driven justification for staying put and negotiating from strength.
Practical Use Cases Beyond Job Offers
The Job Decision Matrix I Job Decider Helper is purpose-built for comparing job offers, but once you understand the logic, you can adapt the same thinking to other career decisions. Consider using a similar approach to evaluate freelance contracts, decide between relocation options, compare graduate school programs, or even choose between major business investments. The yes-based scoring system scales naturally to any decision where you have multiple options and a set of weighted criteria.
For small business owners, the matrix can double as a vendor selection tool or a hiring evaluation framework. The structure is clean enough to use in a team meeting without confusing anyone. Just change the labels at the top and adjust the attributes to match the decision at hand.
Why This Tool Belongs in Your Career Toolkit
Career decisions are high-stakes. Taking a new role affects your income, your daily happiness, your family life, and your long-term trajectory. Spending an hour with a structured matrix is a small investment compared to the cost of a bad job move. The Job Decision Matrix I Job Decider Helper removes the guesswork, surfaces your real priorities, and gives you a clear score you can trust.
It is not about finding the perfect job. That does not exist. It is about finding the best fit among your current options and making that choice with eyes wide open. Download the template, customise it to reflect your values, and let the numbers guide your next career step. Happy job hunting.