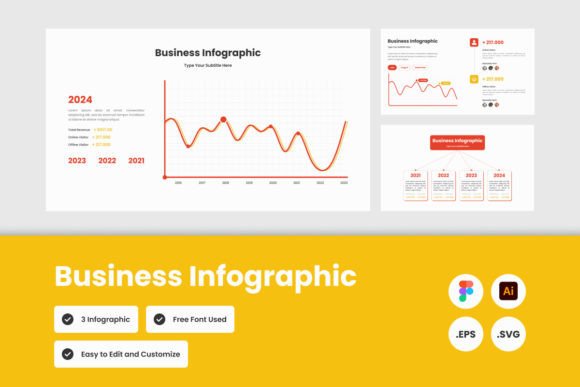
Business Infographic Template V4 for Clear Data
Turning raw numbers into a story that people actually remember takes more than a standard chart. It takes structure, visual hierarchy, and a design that guides the eye without overwhelming it. Business Infographic Template V4 offers exactly that. Instead of starting from a blank canvas and guessing where elements should go, you get a framework built for clarity and impact. Whether you are preparing a quarterly report, a pitch deck, or an internal memo, this template helps you present complex information in a way that feels effortless to the viewer.
What Makes This Template Stand Out
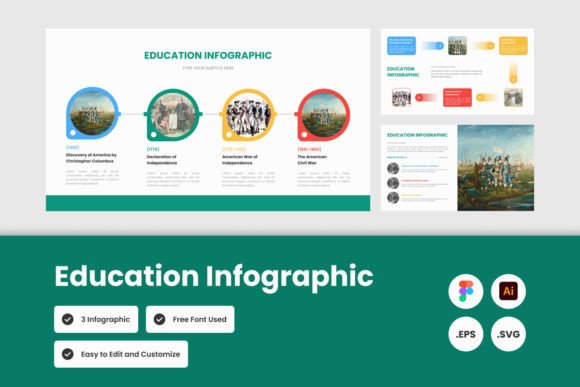
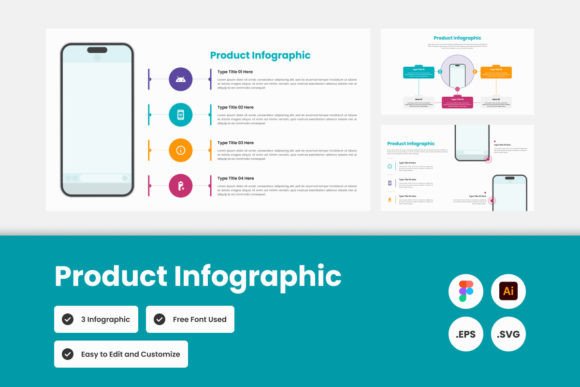
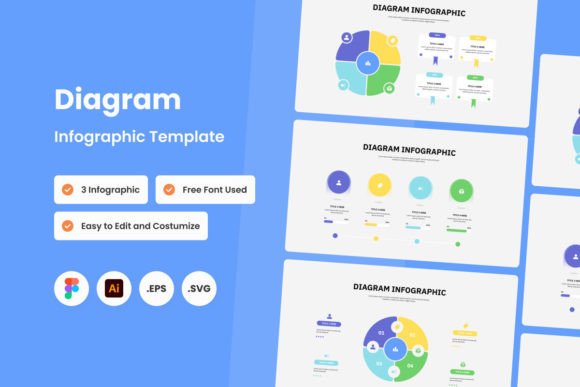
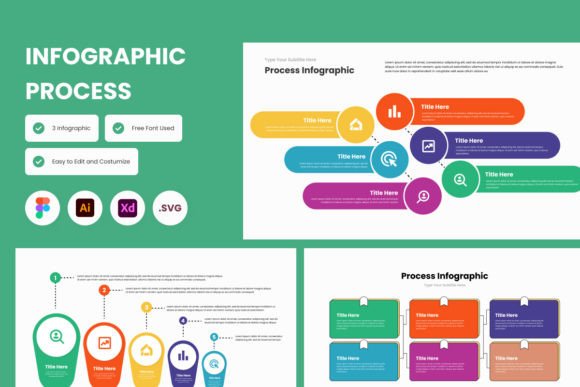
Not all infographic templates are created equal. Many look polished but fall apart when you try to customize them. Business Infographic Template V4 is different because it prioritizes both aesthetics and usability. The three design variations give you options without overwhelming you. Each one maintains a clean, professional look that suits corporate environments, yet leaves room for personality.
The layers are neatly organized, which matters more than most people realize. You can move, hide, or edit individual elements without breaking the layout. This is especially useful when you need to adapt the template for different audiences. A detailed version for the finance team can become a high-level summary for the board with just a few adjustments.
The template uses open source fonts, so you never run into licensing issues or missing typefaces when sharing files. It also comes in multiple formats: Figma, Illustrator, EPS, and SVG. That kind of flexibility means you can work in your preferred software and still collaborate with colleagues who use different tools.
Who Benefits Most from This Template
While the template is designed for business contexts, it works across a surprising range of roles. Marketing professionals can use it to visualize campaign performance, customer demographics, or funnel metrics. Executives can turn quarterly results into a single slide that tells the whole story. Business consultants can package their recommendations with data that clients can grasp in seconds rather than minutes.
Freelancers and small business owners also gain an edge. When you present data in a polished visual format, you signal professionalism that rivals larger agencies. You do not need a full design team to produce something that looks considered and intentional. With this template, you get that credibility built into your workflow.
Practical Uses by Role
- Marketers: Map out customer journey stages with metrics at each touchpoint. Show conversion rates, retention numbers, and LTV in a single view.
- Product managers: Compare feature adoption across releases. Highlight usage trends or A/B test results without burying readers in spreadsheets.
- HR teams: Visualize employee engagement scores, turnover trends, or training completion rates in a way that leadership can act on.
- Founders: Present fundraising progress, burn rate, or growth metrics to investors without losing them in dense slides.
Creative Applications Beyond Standard Reports
Most people think of infographics as one-off assets for presentations or social media. Business Infographic Template V4 can do much more when you start thinking laterally.
Annual Report Summaries
Annual reports tend to be long, dense documents. A printed version has its place, but your audience is increasingly reading on screens. Pull key metrics from the full report and rebuild them using the template as a foundation. Create a one-page visual summary that works as a PDF attachment, a landing page asset, or even a printed leave-behind. The three design variations let you maintain consistent branding while alternating layouts to keep each section fresh.
Internal Knowledge Base Visuals
Company wikis and Notion documents often become walls of text. Use the template to create quick-reference infographics for onboarding, compliance guidelines, or team processes. New hires can absorb organizational structure and key metrics in minutes instead of digging through multiple documents. The organized layers make it easy to update these visuals as data changes throughout the year.
Proposal and Pitch Deck Inserts
A competitive proposal needs to show you understand the client's business. Use the template to recreate the client's current metrics in your pitch, then overlay projected outcomes. This approach moves your proposal from generic claims to specific, data-backed promises. It also demonstrates that you have done the homework, which builds trust before the first meeting even ends.
How to Keep Your Infographic Clear and Effective
Using a good template is only half the equation. The other half is how you populate it. Here are a few practical guidelines that help your final result land well.
Start with One Core Metric
Resist the urge to show everything. An infographic works because it simplifies. Pick the single most important metric that supports your narrative, then arrange supporting numbers around it. If everything seems equally important, your audience will remember nothing. The template's structure naturally supports this because each layout has a clear focal area. Use that spot for your headline number.
Use Consistent Color Logic
The template comes with clean defaults, but you can adapt them. If you change colors, apply them with intention. For example, use one color for revenue-related data points, another for cost metrics, and a neutral tone for context. This consistency helps viewers create mental categories, making the information feel more organized than it actually is.
Keep Labels Short
Long labels clutter the visual field. Use abbreviated labels on the graphic itself and provide a simple legend or footnote if needed. The template's neat layers make it easy to add a legend without distorting the layout. You can also replace placeholder text with your own jargon, but keep the sentence fragments tight.
White Space Is Your Friend
A packed infographic looks like work. A breathable one looks like insight. The template already includes generous spacing in its default form. Do not fill every gap with extra data or icons. Let the layout breathe so the viewer's eye can rest and refocus between data points.
Adapting for Different Platforms and Formats
One infographic can serve multiple purposes if you adapt it properly. The template's SVG and EPS formats are especially useful here because they scale without losing quality.
For a presentation slide, reduce the amount of text and increase the font size slightly. Use the template as a single slide within a larger deck. The layout will hold up on a projected screen or a laptop monitor.
For social media, crop the template to a square or vertical format. Focus on one key insight per graphic. You can create a series of three or four posts from the full infographic, each highlighting a different data point. This approach gives you content for multiple weeks while maintaining a consistent visual identity.
For a PDF report, embed the infographic at full width. The template's organized layers make it easy to export just the graphic without background noise. You can also convert it to a PNG at 300 dpi for high-quality print.
Format Flexibility and Workflow Integration
Business Infographic Template V4 comes with Figma, Illustrator, EPS, and SVG files. If your team works primarily in Figma, you can collaborate in real time and leave comments directly on the design. If you prefer Adobe software, the Ai file gives you full control over every vector. The EPS and SVG versions are useful for developers who need to integrate the graphic into a web page or interactive report.
The open source fonts also mean you can share the source file with a client or contractor without worrying about font activation. Everyone who opens the file will see the same design. This may sound like a small detail, but it saves hours of troubleshooting when you are working across different machines and software versions.
Getting Started Without Overthinking
If you are new to designing infographics, start with the simplest of the three design variations. Open the template, replace the placeholder data with your own numbers, and adjust the colors to match your brand guidelines. Spend five minutes adjusting the layout, then step back and see what the viewer will see first. If it is the most important number, you are done. If not, move that element to the focal area.
Experienced designers can push the template further by combining elements from different variations or adding custom icons that relate to their industry. The neat layers support that kind of experimentation without requiring you to rebuild the entire layout from scratch.
Making Data-Driven Decisions Visible
Data alone rarely motivates action. It is the story you build around it that convinces people to invest, pivot, or prioritize. Business Infographic Template V4 gives you a storytelling tool that respects both the data and the audience. When you present numbers in a clear, visually organized format, you reduce the cognitive load on your viewer. They spend less energy decoding the information and more energy thinking about what it means.
That shift from decoding to insight is where decisions happen. Whether you are pitching a new initiative, reviewing past performance, or setting future goals, the template helps you move from raw data to shared understanding. And in business, shared understanding is often the difference between a meeting that stalls and one that ends with a clear next step.
The template itself is just a starting point. Your content, your audience, and your context determine how effective the final graphic really is. But with a strong foundation like Business Infographic Template V4, you can focus on the message instead of the mechanics. Download the template, try a quick edit with real data, and see how it changes the way your information lands.