Continuing Timeline Infographic Template: A Versatile Tool for Clear Visual Storytelling
When you need to communicate a sequence of events, a project roadmap, or a historical progression, the format you choose can make or break how well your audience understands the information. The Continuing Timeline Infographic Template is designed to help you build structured, visually engaging presentations without requiring advanced design skills. But how does it stack up against other timeline approaches, and when does it truly fit your needs? This article explores what this template offers, how it compares to other styles, and the practical tradeoffs you should consider before using it.
What the Continuing Timeline Infographic Template Offers
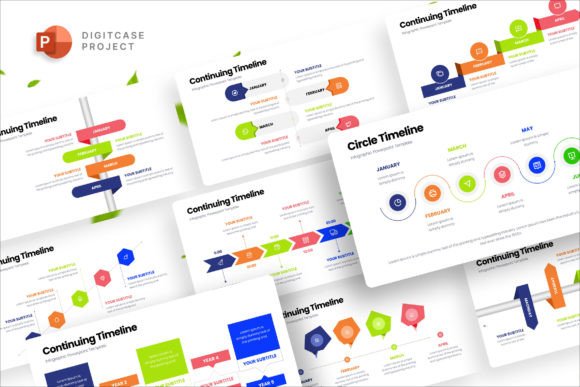
At its core, this template provides a ready-made framework for illustrating a sequence of events or phases across a horizontal or vertical timeline. What makes it distinct is its emphasis on continuity—the design guides the viewer naturally from one point to the next, reinforcing the idea of ongoing progress rather than isolated milestones. Built with vector-based elements, the template allows you to adjust colors, resize components, and rearrange content without losing quality. Each of the 31 slides follows a consistent 16x9 HD ratio, so your presentation looks polished on any screen, from laptops to large displays.
The drag-and-drop image upload feature means you can replace placeholder visuals with your own photos or graphics in seconds. For professionals who need to produce a timeline quickly and want to maintain a clean, modern aesthetic, this template reduces the gap between concept and final slide. It also includes a master slide option, letting you apply global changes to fonts, colors, or layouts across the entire deck effortlessly.
Comparing Timeline Formats: Templates vs. Custom Design vs. Software Tools
When you need a timeline, you generally have three routes: use a pre-built infographic template like the Continuing Timeline Infographic Template, design one from scratch in software like Adobe Illustrator or PowerPoint, or rely on specialized timeline tools or project management platforms. Each approach has its own strengths and tradeoffs.
Pre-Built Templates
Templates offer the fastest path to a professional-looking result. With the Continuing Timeline Infographic Template, you get vector shapes that are fully editable, which means you can tailor colors, sizes, and text without worrying about pixelation. The learning curve is low—if you can drag and drop, you can use it. This makes it ideal for non-designers who need a polished outcome quickly. However, you are working within a predefined structure. While the 31 slides offer variety, you may find that certain slide layouts don't perfectly accommodate highly specific or asymmetrical data. If your timeline requires unusual branching, multiple levels of detail, or non-linear progression, you might need to adapt the template or combine slides to get the result you envision.
Custom Design
Designing a timeline from scratch gives you full creative freedom. You can place elements exactly where you want them, use unique typography, and craft a visual flow that matches your brand with precision. The tradeoff is time and skill. Creating vector shapes, aligning them, and ensuring consistent spacing across slides takes hours—especially if you need to produce multiple timelines for a single presentation. For experienced designers, this approach yields a bespoke outcome. For others, it can lead to frustration, inconsistent results, or simply too much time spent on formatting rather than content. The Continuing Timeline Infographic Template essentially bridges this gap: it offers a professional starting point that reduces the time investment while still allowing customization.
Specialized Timeline Software and Tools
Some project management or timeline-specific tools (like Gantt chart software or dedicated infographic builders) offer automated timeline generation. These can be excellent for data-heavy timelines where dates, durations, and dependencies matter—such as in project planning or product development. The strength of these tools is their ability to handle complex data and update automatically when timelines shift. The limitation is that they often produce outputs that feel more functional than visually engaging. Exported timelines from such tools may look like spreadsheets or charts rather than infographic-style slides. If you are presenting to clients, executives, or a general audience, the visual appeal of the Continuing Timeline Infographic Template can make a stronger impression. However, for ongoing, data-driven timelines that need frequent updates, a specialized tool may be more practical.
Strengths of the Continuing Timeline Infographic Template
- Ease of Use: No graphic design experience required. The template is built so that anyone can change colors, replace images, and edit text with minimal effort.
- Vector Flexibility: Because all elements are vector shapes, you can scale them without loss of quality, and color changes are simple and consistent.
- 32% More Slides Than Many Similar Templates: With 31 slides, you have enough variety to cover different timeline lengths, from 3 stages to 10 or more, without needing to reuse the same layout.
- Master Slide Efficiency: Update fonts, colors, or placeholders across all slides at once, saving time when you need to align with brand guidelines.
- Responsive Output: The 16x9 ratio ensures your presentation looks good on modern screens, projectors, and video conferencing platforms alike.
Tradeoffs and Limitations to Consider
No single tool is ideal for every situation, and the Continuing Timeline Infographic Template has its own boundaries. One limitation is that it is designed primarily for linear or continuing timelines. If your data involves cyclical patterns, overlapping events, or non-chronological relationships, the template may not naturally represent those structures without significant reworking. You could repurpose some slides by hiding or moving elements, but it would not be as clean as a template built specifically for those patterns.
Another tradeoff is the reliance on stock photos that are not included. While the template provides placeholders, you need to supply your own images. For some users, this is a plus—you can use your own photography or brand imagery. For others, it means an extra step of sourcing or creating visuals. If you do not have access to high-quality images, the final presentation may look less polished than expected.
Additionally, while the template offers easy color customization, users with very specific brand color palettes may find that the pre-built color schemes need considerable adjustment. The vector shapes make this possible, but it still requires some effort to match exact hex codes or maintain contrast across slides.
When This Template Is the Right Choice
The Continuing Timeline Infographic Template works best when you need to present a clear, ongoing sequence of events to an audience that values clarity and visual appeal. Consider using it if you are:
- Presenting a company history or product evolution to stakeholders or clients
- Outlining a multi-phase project roadmap where the focus is on progression rather than granular dates
- Creating educational content that explains a process step by step
- Designing a marketing or sales presentation that needs to show a journey or growth story
- Producing slides for a conference or webinar where you want consistent, professional visuals without hiring a designer
In these situations, the template saves you time and helps you avoid common design pitfalls like inconsistent alignment, cluttered slides, or hard-to-read typography.
When You Might Need a Different Option
If your timeline requires detailed date ranges, task dependencies, or resource assignments, a dedicated project management tool or Gantt chart generator may serve you better. Those tools are built for precision and updateability, whereas the Continuing Timeline Infographic Template is built for visual communication. Similarly, if you need a highly unconventional timeline—such as a circular or radial layout, or one that maps events across multiple dimensions—a custom design or a specialized infographic tool with more varied templates might be necessary.
Another scenario is when your brand guidelines are extremely strict regarding layout or typography. While the template is editable, it is not infinitely flexible. If your brand demands a specific slide architecture that deviates significantly from the template's default flow, you may spend more time adapting than you would if you started from scratch.
Practical Examples: Seeing the Template in Action
Imagine you are a product manager presenting the evolution of a software platform over five years. You have key milestones—version releases, feature additions, customer growth points. With the Continuing Timeline Infographic Template, you can place each milestone along a horizontal line, use color coding to differentiate between major and minor releases, and add images of the product interface at each stage. The continuity of the timeline emphasizes the steady progress, helping your audience see not just isolated events but the overall trajectory.
Now consider a nonprofit organization presenting a decade of impact to donors. A similar timeline could highlight key projects, funding milestones, and community outcomes. By using the template's vector shapes to scale icons or map growth over time, the presentation feels both professional and emotionally resonant. The ability to drag and drop photos of beneficiaries or events makes the data feel human.
In both cases, the alternative—building a timeline from scratch in PowerPoint or Keynote—would require manual alignment of shapes, consistent color application, and careful spacing. The template eliminates those repetitive tasks, letting you focus on the story behind the timeline.
Key Decision Factors: What to Evaluate Before Choosing
When deciding whether the Continuing Timeline Infographic Template fits your project, consider these factors:
- Time vs. Control: How much time do you have to create the presentation? If you need results quickly, the template wins. If you need total design control, custom work may be worth the extra hours.
- Audience Expectations: Will your audience respond better to a polished infographic-style timeline or a more data-dense chart? For many business and educational contexts, the clean visual style of this template aligns well with audience preferences.
- Update Frequency: If the timeline will need regular updates, consider whether you prefer to edit the template slides or use a tool that automatically recalculates dates and milestones.
- Visual Consistency: If you are producing a series of presentations or slides across a team, the master slide feature ensures everyone stays on brand without extra oversight.
- Skill Level of the Creator: For users who are not comfortable with design software, the template's drag-and-drop simplicity is a major advantage.
Making an Informed Decision
The Continuing Timeline Infographic Template is a well-rounded asset for anyone who needs to create professional, continuing timeline presentations efficiently. Its strength lies in its balance between ease of use and customization—offering enough flexibility to adapt to different content while reducing the friction of starting from a blank slide. It is not a replacement for project management tools or custom design work when those are the right fit, but for the vast majority of business, educational, and marketing timeline needs, it provides a solid, time-saving foundation.
Before committing, assess the nature of your timeline data, the level of detail required, and the visual expectations of your audience. If a clear, linear progression is at the heart of your story, this template can help you tell it effectively. If your needs are more complex or your brand demands a bespoke approach, consider combining this template with other tools or investing in a custom solution. Either way, understanding the tradeoffs will help you choose the path that best serves your presentation goals.