2025 Social Media Content Dashboard
If you manage social media for a living, you already know the drill—endless spreadsheets, manual data pulling, and the dreaded feeling that you are missing something important. The 2025 Social Media Content Dashboard, paired with the 2025 Social Media Engagement and Growth Dashboard, changes that entirely. This is a set of interactive, data-driven Google Sheets tools built to handle the chaos of multi-platform management. Whether you're a solopreneur juggling Instagram and LinkedIn or a marketing lead overseeing five brand accounts, these dashboards bring clarity to the noise.
A Single Pane of Glass for Your Social Strategy
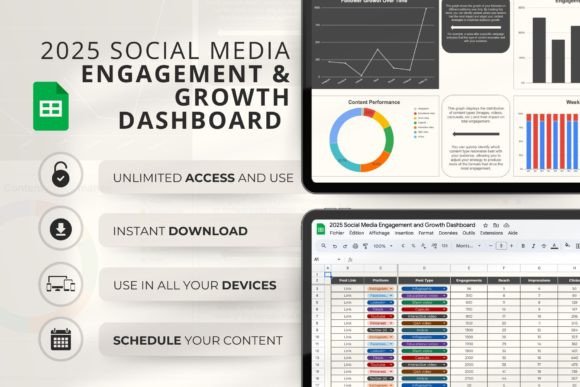
What does the 2025 Social Media Content Dashboard actually look like? Picture a clean, well-organized spreadsheet that feels more like a purpose-built app than a traditional grid of rows and columns. The layout uses a muted color palette with intentional highlights—think soft blues, neutral grays, and subtle accent colors that call attention to key metrics. The dashboards are divided into logical zones: content planning, publishing calendar, engagement metrics, growth trends, and performance benchmarks. Tabs at the bottom separate platforms like Instagram, TikTok, Facebook, Twitter, Pinterest, and LinkedIn, so you can toggle between them without losing your train of thought.
The personality here is professional but not rigid. It looks like it belongs in a modern marketing agency—functional, minimal, and built for fast decision-making. Conditional formatting brings high-performing posts to the top, and dropdown menus let you filter by content type, date range, or platform. There is no fluff. Every cell serves a purpose, and the visual hierarchy guides your eye from the big picture down to the details. That matters when you are reviewing performance before a client meeting or planning next month's content calendar.
Where These Dashboards Fit Into Your Workflow
These tools work across a wide range of projects and team sizes. A freelance content creator can use the content dashboard to batch-plan two weeks of posts, track caption variations, and log which visuals performed best. A social media manager at a growing brand can load the engagement and growth dashboard to monitor follower trends, track response rates, and compare month-over-month progress across platforms. Small business owners who handle their own marketing will appreciate the built-in formulas that calculate growth percentages and engagement rates automatically—no math required.
Beyond day-to-day management, the dashboards are useful for reporting. You can pull data directly from platform insights, paste it into the relevant sections, and watch your key metrics populate in real time. This makes it much easier to present results to stakeholders or plan paid campaigns based on organic performance. The design assets built into the sheets—like progress bars and sparkline charts—add visual punch without requiring design skills. It is a practical tool that becomes more valuable the more you use it.
How the Dashboards Influence Your Content and Engagement
The real power of the 2025 Social Media Content Dashboard lies in how it shapes your thinking. When you have a clear view of your posting history, engagement data, and audience growth all in one place, patterns start to emerge. You might notice that your Instagram Reels outperform static carousels by a significant margin, or that LinkedIn posts with a question in the first line get twice the comments. That kind of insight is hard to see when data lives in separate platform dashboards. Once it is centralized, your strategy can evolve based on evidence rather than intuition.
Consistency is another area where these dashboards make a tangible difference. By mapping out your content schedule in advance and tracking publish dates against engagement spikes, you can refine your posting cadence without guesswork. The engagement dashboard also tracks metrics like response time and comment volume, which are often overlooked but matter for algorithm visibility. On TikTok and Instagram, for instance, rapid engagement signals quality content. Having a place to monitor that regularly keeps you accountable.
Brand perception also benefits from this structured approach. When your content is planned, reviewed, and analyzed systematically, the output becomes more cohesive. Your visual identity stays consistent, your captions align with your brand voice, and your posting schedule feels reliable to your audience. The dashboard does not design your content for you, but it provides the framework to ensure every piece of content contributes to your larger goals.
Practical Guidance for Getting the Most Out of the Dashboards
To really make these tools work for you, start by customizing the metrics that matter most to your specific goals. If you run a service-based business, you might prioritize engagement rate and click-throughs. If you are a publisher, focus on reach and share counts. The dashboards come with default categories, but every row and column is editable. Tailor them to your niche. I recommend spending an hour during setup to rename headers, adjust date ranges, and connect the formulas to your reporting sources. That upfront time pays back tenfold later.
Testing different content types is another area where these dashboards excel. Create a tagging system inside the content dashboard—label posts as educational, entertaining, promotional, or behind-the-scenes. After a month, sort by those tags and compare engagement metrics side by side. You will quickly see which content style resonates most with your audience. Similarly, the growth dashboard lets you compare follower acquisition channels. If you notice a spike from Instagram Stories but not from feed posts, you can double down on what works.
Readability matters inside the dashboard itself. Use consistent naming conventions for your campaigns, and avoid generic labels like "post 1" or "tweet 3." Instead, use descriptive names that include the platform, content type, and goal. For example, "IG_Reel_Tips_March" or "LI_Carousel_CaseStudy." That level of detail makes filtering and reporting much smoother. The conditional formatting already highlights high and low performers, so your attention goes straight to the outliers.
When evaluating whether this dashboard fits your existing workflow, consider how you currently track social data. If you rely on Google Sheets already, the learning curve is negligible. If you are using a dedicated scheduling tool, the dashboard works well as a companion for analysis and reporting. It is not a replacement for publishing tools like Buffer or Hootsuite, but it fills the gap where those platforms often fall short: deep, customizable analysis and long-term trend tracking.
Real-World Scenarios and Design Observations
I have seen teams use the 2025 Social Media Content Dashboard in creative ways. One marketing coordinator I work with uses it to plan content for a small retail brand across Instagram, Pinterest, and TikTok. She prints the monthly view and uses it as a whiteboard for brainstorming sessions. The visual layout makes it easy for non-digital team members to contribute ideas. Another entrepreneur runs a newsletter and uses the engagement dashboard to track which social channels drive the most email signups. She correlates specific post types with conversion data, something most native analytics tools don't handle well.
From a design perspective, the dashboards follow smart principles of modern typography and layout. The use of header rows, data bars, and inline charts creates a visual hierarchy that mimics a well-designed report. That might sound like a small detail, but when you are presenting these numbers to a client or boss, the format inspires confidence. It looks professional without being overly complex. The neutral background and restrained use of color keep the focus on the data, which is exactly where it should be.
I also appreciate how the dashboards handle multi-platform data. Each platform has its own nuances—Instagram values engagement rate, TikTok favors watch time, LinkedIn rewards comment depth. The 2025 Social Media Content Dashboard respects those differences by offering platform-specific fields while keeping the overall structure consistent. This balance between standardization and customization is harder to achieve than it looks, and it makes the tool usable across diverse industries.
Licensing and Practical Considerations
Because these dashboards are delivered as Google Sheets files, licensing is straightforward. You purchase the templates once and use them across your own accounts and projects. There are no recurring fees or platform lock-ins. If you work with clients, you can duplicate the dashboard for each account and keep reporting clean and separate. That makes it a good investment for freelancers and agencies who manage multiple brands. The dashboards are also compatible with Google Sheets export features, so you can download them as Excel files if needed.
One thing to keep in mind: these tools require you to input your own data. They do not connect directly to social media APIs. That means you spend a few minutes each week copying metrics from your platform dashboards into the sheets. For most people, that trade-off works well because the analysis capabilities far exceed what native tools provide. Over time, you build a historical dataset that helps you spot seasonal shifts, content fatigue, and growth opportunities months in advance.
The 2025 Social Media Content Dashboard and the 2025 Social Media Engagement and Growth Dashboard together form a complete system. One handles planning and content tracking; the other focuses on audience behavior and growth patterns. Used together, they give you a full picture of your social media performance without the overhead of expensive analytics software. For anyone serious about improving their social strategy without adding complexity, these templates deliver real, day-to-day value.